DevOps Monitoring Tools: Prometheus, Grafana, and Datadog Explained
Introduction
- Monitoring is essential in DevOps for ensuring application reliability, performance, and security.
- Prometheus, Grafana, and Datadog are three widely used monitoring tools.
- This guide explores their features, use cases, and how they fit into a DevOps workflow.
1. Prometheus: The Open-Source Monitoring System
What is Prometheus?
- A time-series database and monitoring tool originally developed by SoundCloud.
- Uses a pull-based model to collect metrics from applications and infrastructure.
- Ideal for cloud-native and Kubernetes environments.
Key Features
- Multi-dimensional data model using labels.
- Powerful query language (PromQL) for data analysis.
- Alerting via Alertmanager for real-time notifications.
- Integration with Kubernetes, Docker, and other services.
Use Cases
- Monitoring microservices and containers in Kubernetes.
- Setting up alerting based on real-time application metrics.
- Analyzing system performance trends over time.
2. Grafana: Visualization and Analytics
What is Grafana?
- A visualization and dashboarding tool that integrates with multiple data sources, including Prometheus.
- Helps in creating real-time, interactive dashboards.
Key Features
- Customizable and interactive dashboards.
- Supports multiple data sources (Prometheus, Elasticsearch, MySQL, etc.).
- Alerting with various notification channels.
- Plugins and integrations for extending functionality.
Use Cases
- Visualizing time-series data from Prometheus.
- Creating real-time dashboards for server and application health.
- Integrating with DevOps tools for centralized monitoring.
3. Datadog: A Full-Stack Monitoring Solution
What is Datadog?
- A cloud-based monitoring platform providing observability across infrastructure, applications, and logs.
- Offers real-time performance monitoring, security, and analytics.
Key Features
- Unified monitoring for metrics, logs, and traces.
- AI-driven anomaly detection.
- Cloud-native and serverless monitoring support.
- Automatic integrations with AWS, Azure, Kubernetes, and more.
Use Cases
- Comprehensive monitoring of cloud and hybrid environments.
- Anomaly detection using machine learning.
- Security and compliance monitoring for DevOps teams.
4. Choosing the Right Tool for Your DevOps Needs
Conclusion
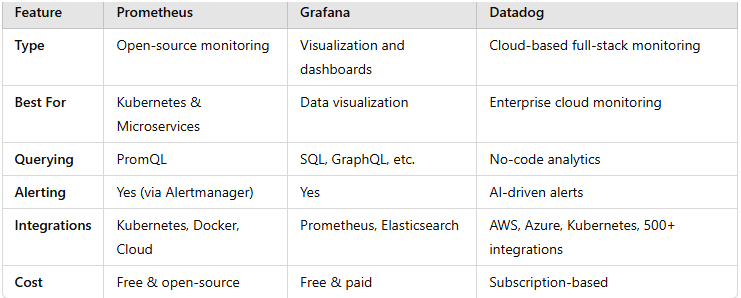
- Prometheus is best for monitoring cloud-native applications.
- Grafana is ideal for visualization and dashboarding.
- Datadog offers full-stack observability for enterprises.
- The choice depends on your infrastructure, budget, and monitoring needs.
WEBSITE: https://www.ficusoft.in/devops-training-in-chennai/


Comments
Post a Comment