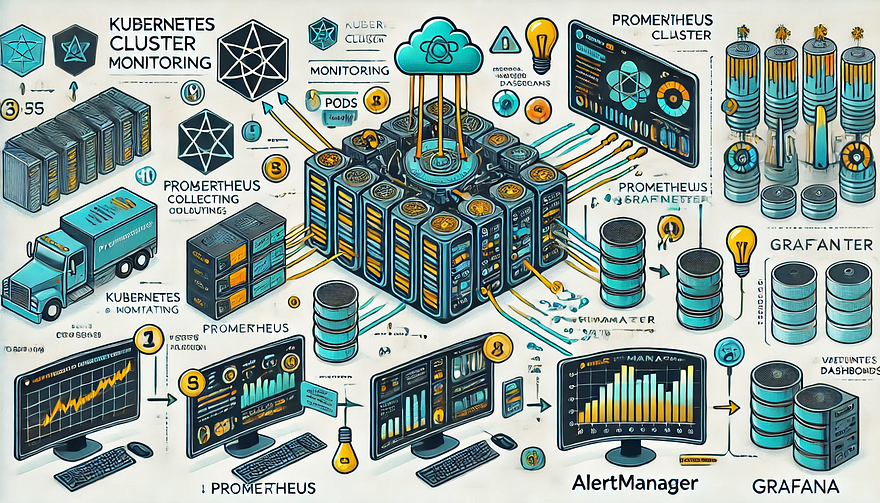
Monitoring Kubernetes Clusters with Prometheus and Grafana
Introduction
Kubernetes is a powerful container orchestration platform, but monitoring it is crucial for ensuring reliability, performance, and scalability.
Prometheus and Grafana are two of the most popular open-source tools for monitoring and visualizing Kubernetes clusters.
In this guide, we’ll walk you through setting up Prometheus and Grafana on Kubernetes and configuring dashboards for real-time insights.
Why Use Prometheus and Grafana for Kubernetes Monitoring?
Prometheus: The Monitoring Backbone
- Collects metrics from Kubernetes nodes, pods, and applications.
- Uses a powerful query language (PromQL) for analyzing data.
- Supports alerting based on predefined conditions.
Grafana: The Visualization Tool
- Provides rich dashboards with graphs and metrics.
- Allows integration with multiple data sources (e.g., Prometheus, Loki, Elasticsearch).
- Enables alerting and notification management.
Step 1: Installing Prometheus and Grafana on Kubernetes
Prerequisites
Before starting, ensure you have:
- A running Kubernetes cluster
kubectland Helm installed
1. Add the Prometheus Helm Chart Repository
Helm makes it easy to deploy Prometheus and Grafana using predefined configurations.
shhelm repo add prometheus-community https://prometheus-community.github.io/helm-charts
helm repo update2. Install Prometheus and Grafana Using Helm
shhelm install prometheus prometheus-community/kube-prometheus-stack --namespace monitoring --create-namespaceThis command installs:
✅ Prometheus — For collecting metrics
✅ Grafana — For visualization
✅ Alertmanager — For notifications
✅ Node-exporter — To collect system-level metrics
Step 2: Accessing Prometheus and Grafana
Once deployed, we need to access the Prometheus and Grafana web interfaces.
1. Accessing Prometheus
Check the Prometheus service:
shkubectl get svc -n monitoringForward the Prometheus server port:
shkubectl port-forward svc/prometheus-kube-prometheus-prometheus 9090 -n monitoringNow, open http://localhost:9090 in your browser.
2. Accessing Grafana
Retrieve the Grafana admin password:
shkubectl get secret --namespace monitoring prometheus-grafana -o jsonpath="{.data.admin-password}" | base64 --decodeForward the Grafana service port:shkubectl port-forward svc/prometheus-grafana 3000:80 -n monitoringOpen http://localhost:3000, and log in with:
- Username:
admin - Password: (obtained from the previous command)
Step 3: Configuring Prometheus as a Data Source in Grafana
- Open Grafana and navigate to Configuration > Data Sources.
- Click Add data source and select Prometheus.
- Set the URL to:
- Click Save & Test to verify the connection.
Step 4: Importing Kubernetes Dashboards into Grafana
Grafana provides ready-made dashboards for Kubernetes monitoring.
- Go to Dashboards > Import.
- Enter a dashboard ID from Grafana’s dashboard repository.
- Example: Use 3119 for Kubernetes cluster monitoring.
- Select Prometheus as the data source and click Import.
You’ll now have a real-time Kubernetes monitoring dashboard! 🎯
Step 5: Setting Up Alerts in Prometheus and Grafana
Creating Prometheus Alerting Rules
Create a ConfigMap for alerts:
yamlapiVersion: v1
kind: ConfigMap
metadata:
name: alert-rules
namespace: monitoring
data:
alert.rules: |
groups:
- name: InstanceDown
rules:
- alert: InstanceDown
expr: up == 0
for: 5m
labels:
severity: critical
annotations:
summary: "Instance {{ $labels.instance }} is down"Apply it to the cluster:
shkubectl apply -f alert-rules.yamlConfiguring Grafana Alerts
- Navigate to Alerting > Notification Channels.
- Set up a channel (Email, Slack, or PagerDuty).
- Define alert rules based on metrics from Prometheus.
Step 6: Enabling Persistent Storage for Prometheus
By default, Prometheus stores data in memory. To make the data persistent, configure storage:
Modify the Helm values:
yamlprometheus:
server:
persistentVolume:
enabled: true
size: 10GiApply the changes:
shhelm upgrade prometheus prometheus-community/kube-prometheus-stack -f values.yamlConclusion
In this guide, we’ve set up Prometheus and Grafana to monitor a Kubernetes cluster. You now have:
✅ Real-time dashboards in Grafana
✅ Prometheus alerts to detect failures
✅ Persistent storage for historical metrics
WEBSITE: https://www.ficusoft.in/devops-training-in-chennai/


Comments
Post a Comment